
Power Pillar: see at a glance where the home's power comes from
Power Pillar is a mobile app for monitoring and controlling a home's power system: solar, grid, generator and stored battery power. The client is Panasonic R&D Center Vietnam, the research and development centre of the Panasonic Group. Sinh Vũ designed the logo and interface so that ordinary users can tell which source is running in a single look.
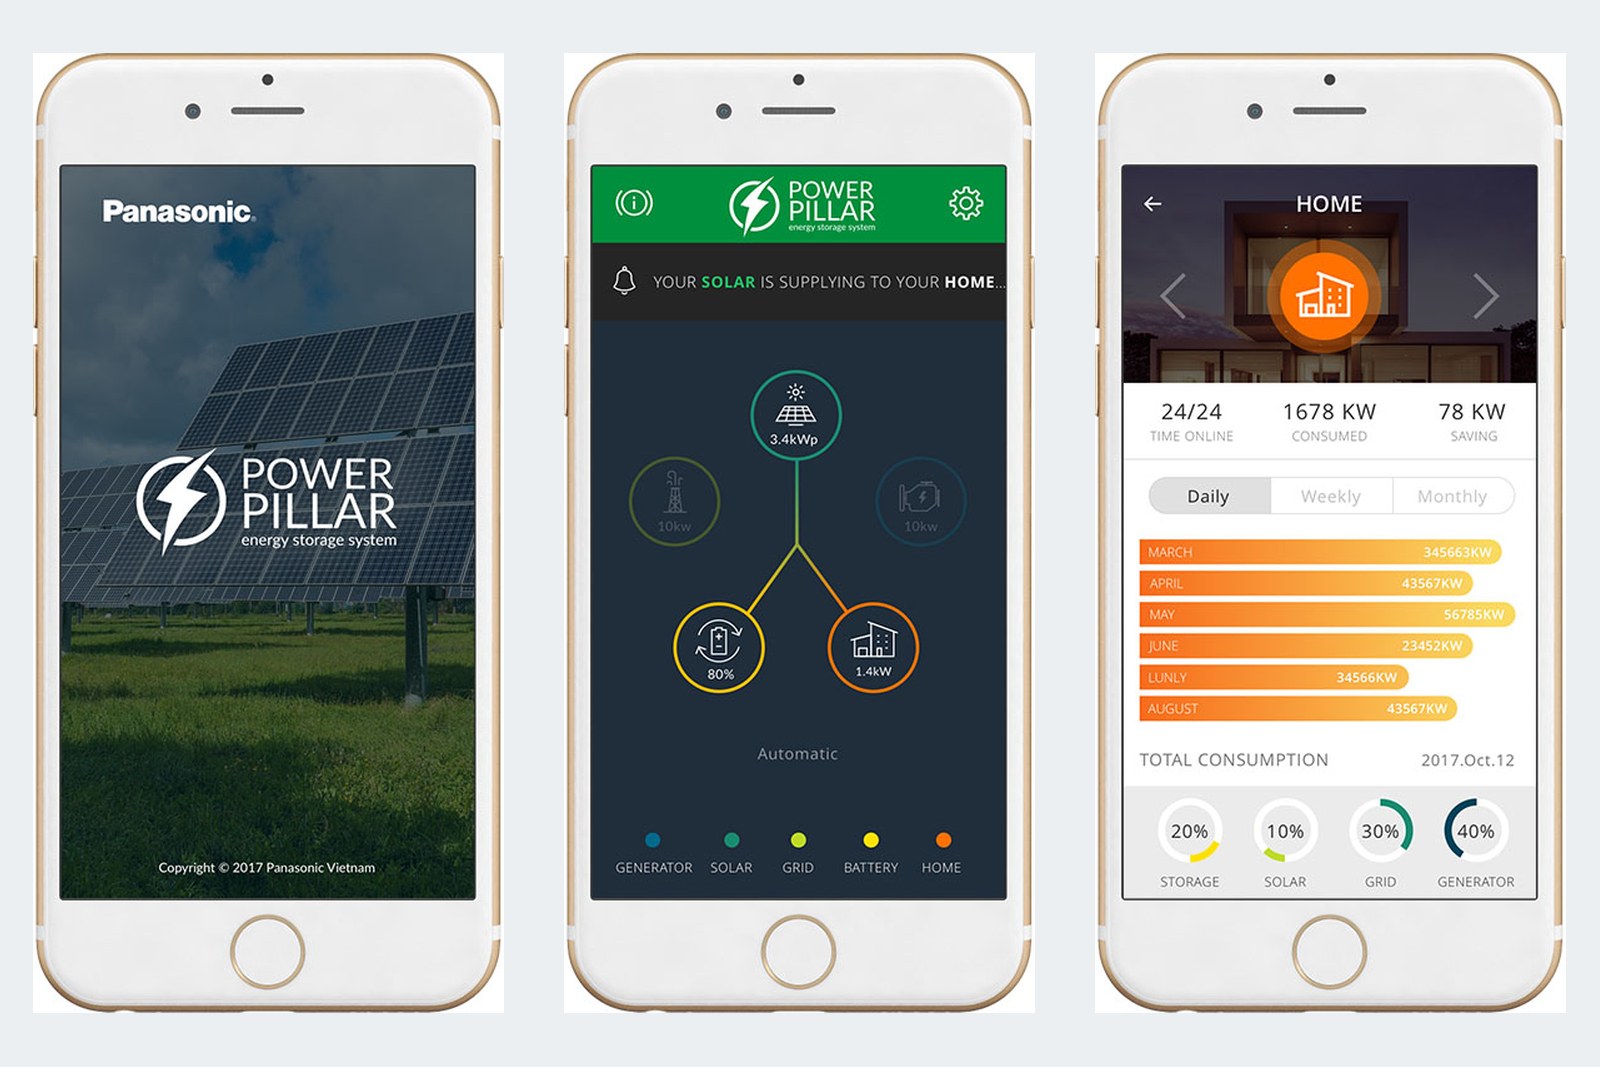
Four power sources on one screen
A home can use solar power, grid power, generator power and battery power released through an inverter, all at the same time. Panasonic R&D Center Vietnam needed one app to control these sources together, so users could view and switch them on and off from their phones.
The brief: a high-contrast interface, meaning light and dark colours that differ clearly so it is easy to see. Users had to tap easily, recognise the running source from pictures, and get notifications, warnings and statistics charts. Use had to feel familiar, because the users are ordinary customers, not electrical engineers.
A lightning bolt logo
The Power Pillar logo is a green lightning bolt cutting through an open dark circle, set beside the words POWER PILLAR and a small line, energy storage system. This power symbol is drawn in the same style as the icons inside the app.
The lettering is plain and familiar, so it shows clearly both on screen and in print. The white version sits on the photo of solar panels on the launch screen. The multicolour version sits on white on the introduction and login screens.
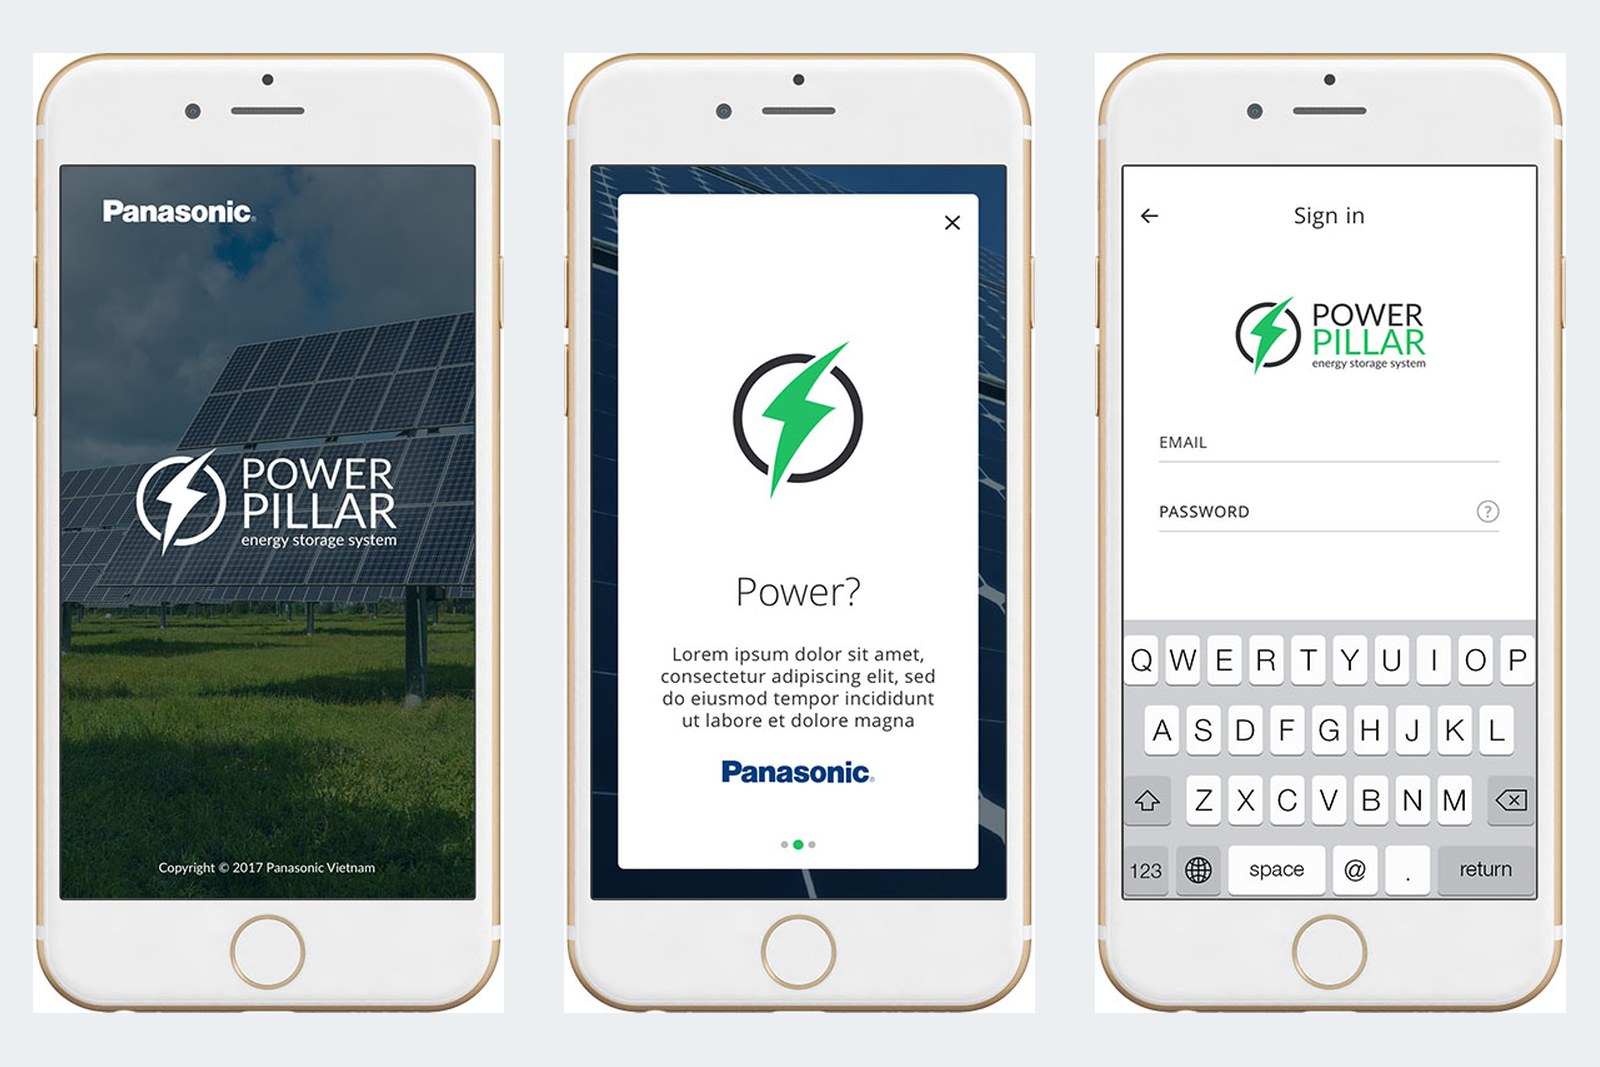
The power source diagram
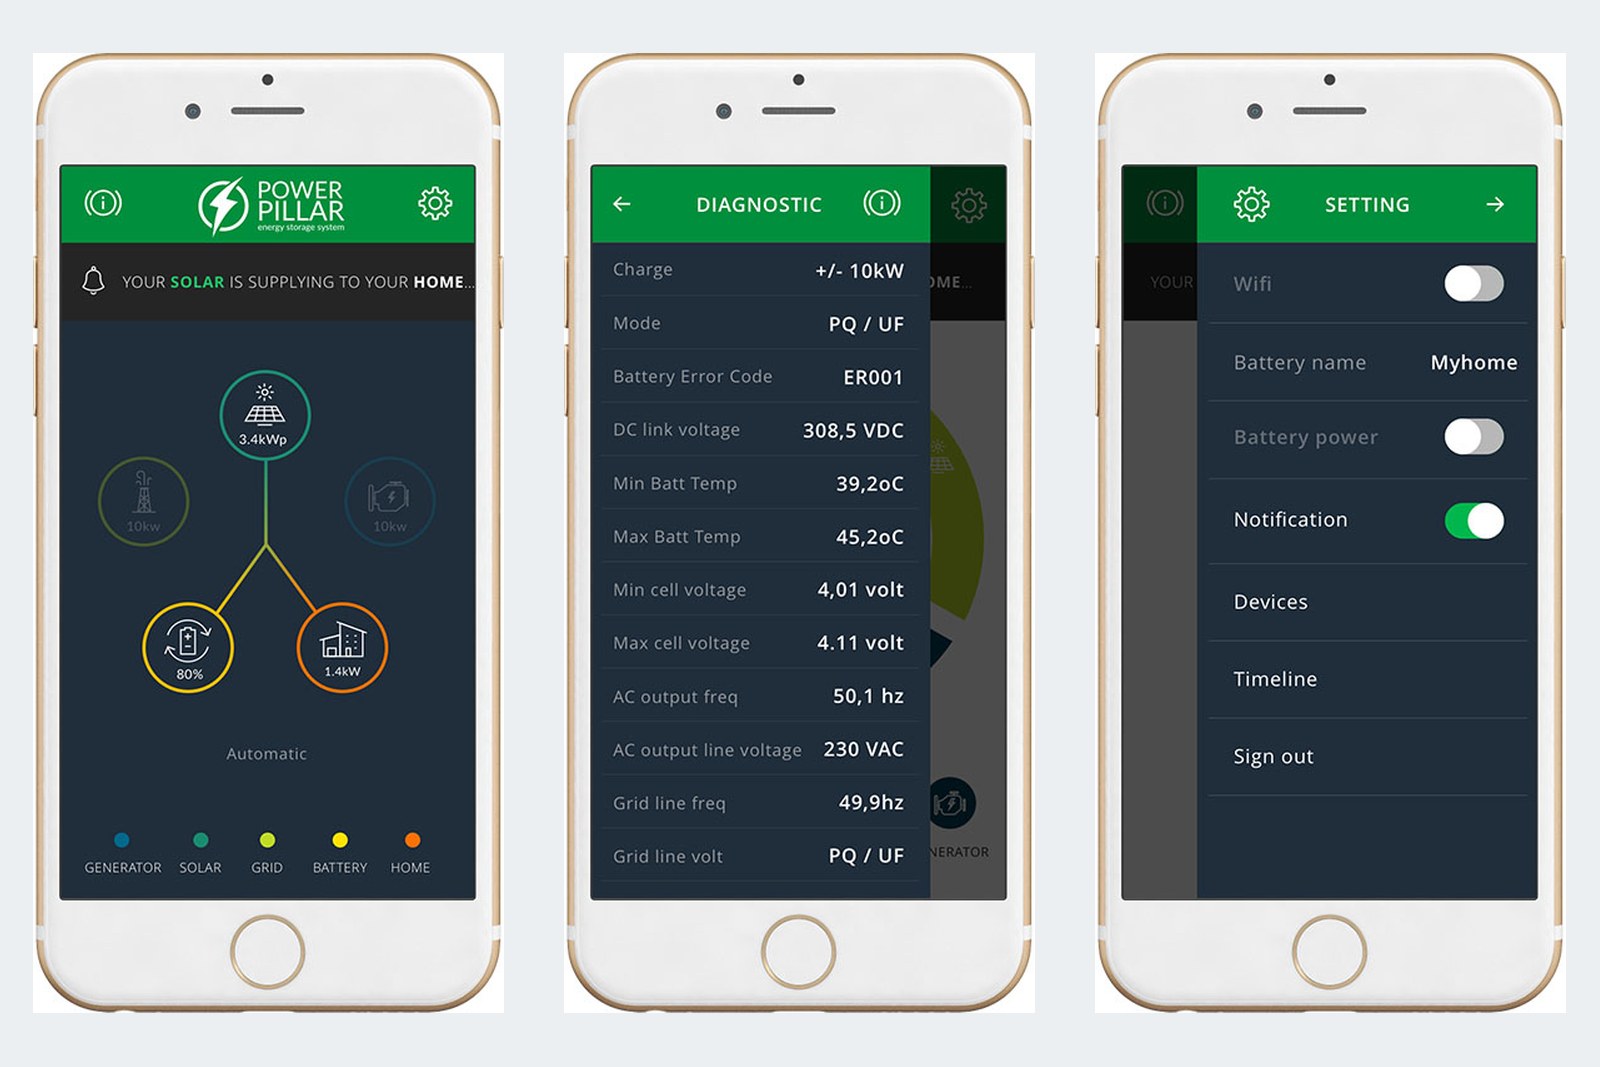
The main screen has a deep blue-black background. The solar panel sits at the top, with the storage battery and the house below it, joined by lines. A running source has a bright circle and an idle one is dimmed, so brightness alone tells the story.
Just under the header, a short line states the situation, for example solar power is supplying the house. At the bottom is a five-colour key for the generator, solar, grid, battery and house. From the main screen, users can open the diagnostics screen to see technical readings, and the settings screen.
Statistics that are easy to read
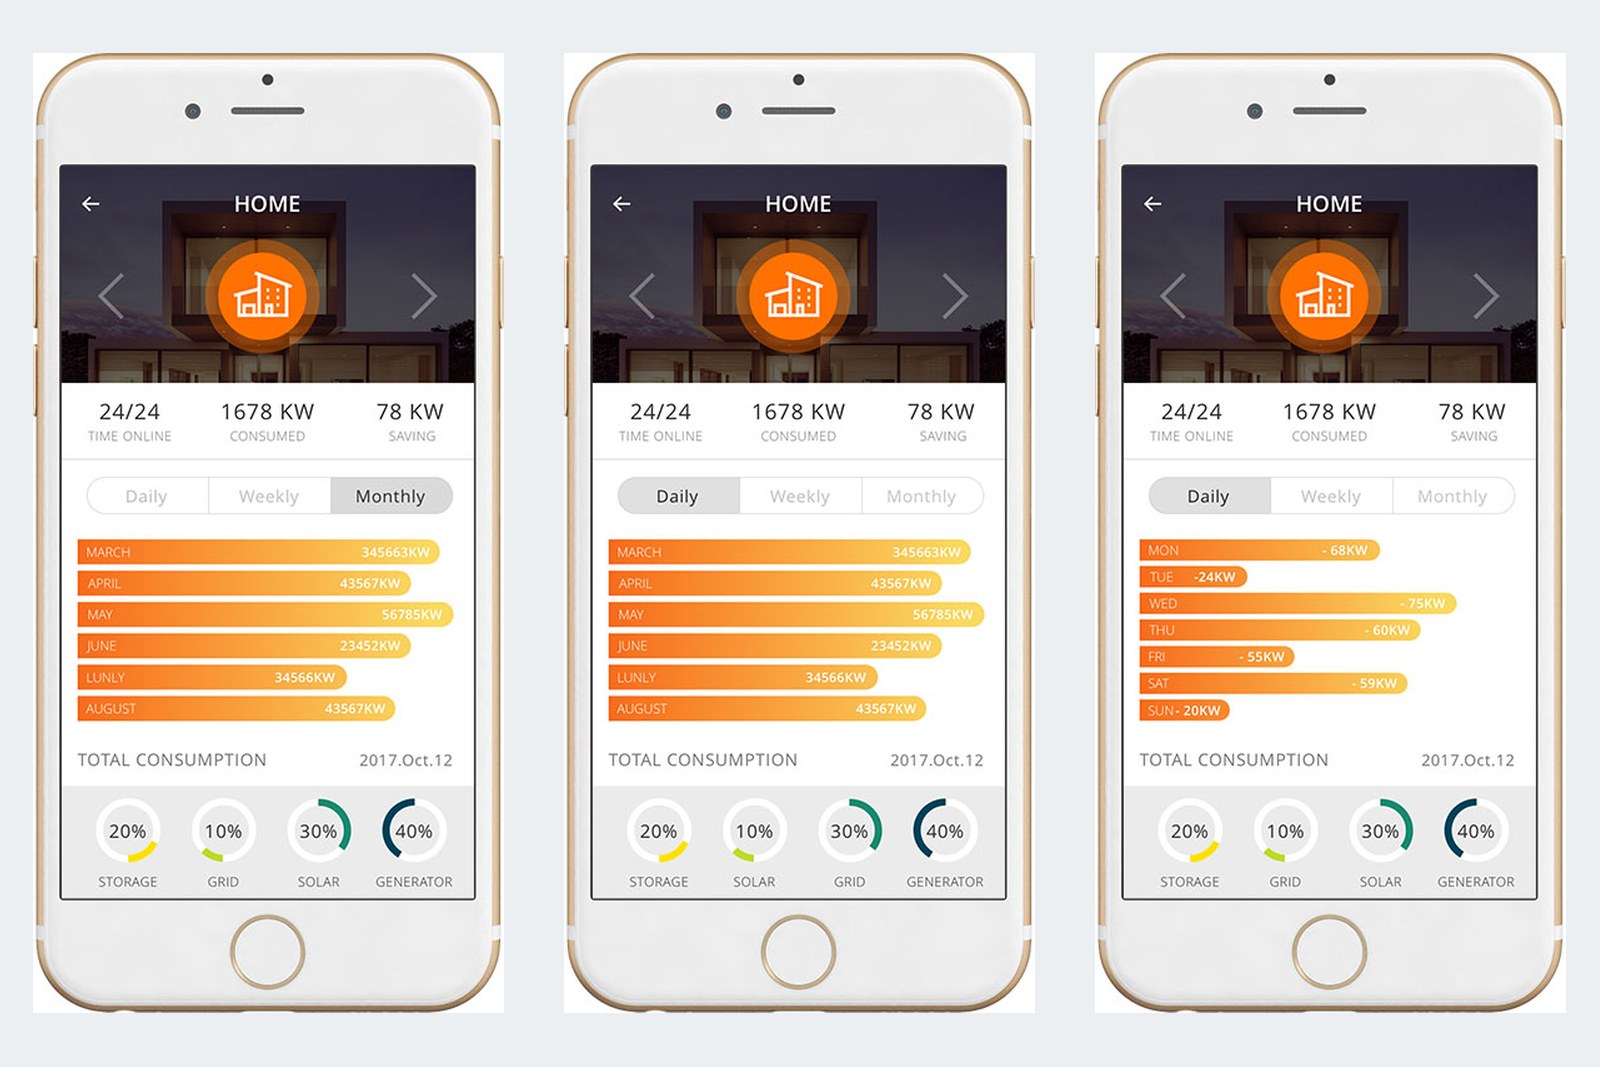
The home's statistics screen shows energy by day, week or month in orange horizontal bars. At the top are three main figures: connected time, power used and power saved. Below are four circles showing the percentage each source contributes.
Horizontal bars and percentage circles are two charts everyone knows, so users can read the figures without any instructions.
The value
Sinh Vũ ran the project in two phases. The first covered the interface: showing the on and off state of each power source, the chart types and system status notifications. The second covered user experience, meaning how things are arranged and the order of use, so the overview stays simple, familiar and friendly to ordinary users.
As a result, users need no knowledge of electrical engineering to know which source the house is drawing from, through familiar colours and charts alone.
In their own words
Well-finished design that met every requirement set for the product. Everyday users can read the diagram and see where power comes from and where it goes. Thank you, Sinh Vũ, for being part of Power Pillar's success.